Fleet Idle Reduction Starts with Idle Percentage and Idle Cost
ELD tampering and falsification are a major Roadcheck focus this year. Here’s how fleet teams can prepare.
By Gridline Editorial
3 mins to read
Idling is one of the few fleet expenses that delivers nothing in return. An idling truck burns fuel and adds engine hours without moving any freight, yet the cost rarely appears as its own line item because it is buried inside the monthly fuel bill. As a result, many fleets know idle is a problem without knowing how large it is or who can fix it.
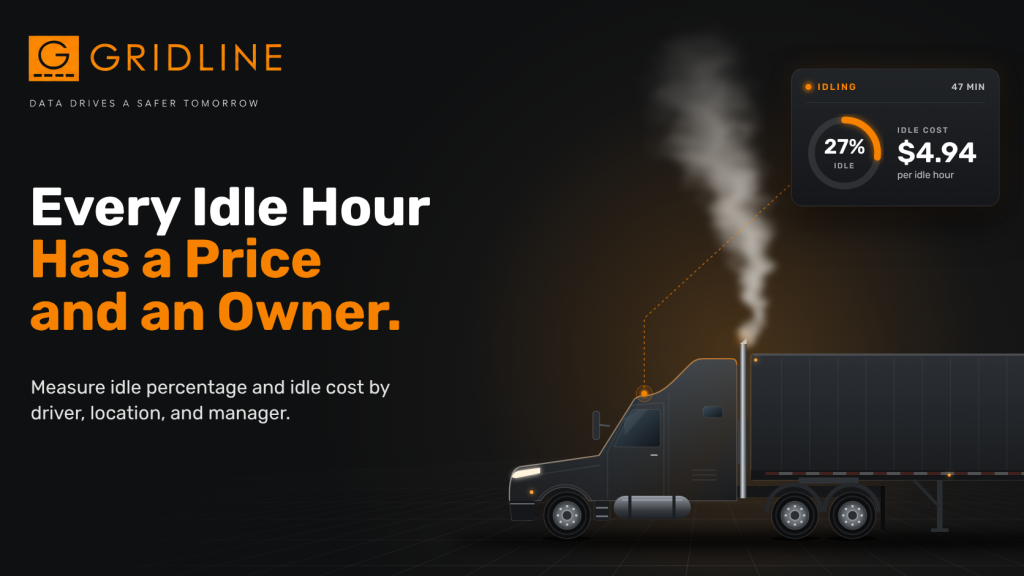
Part of the challenge is how most telematics platforms report idle. They show how many hours a vehicle spent idling, which tells you how long the engine ran in place but not whether that number is good, bad, or getting worse. With Gridline Analytics, idle is measured as a percentage of engine time, translated into dollars, and assigned to the drivers, locations, and managers responsible for it. Let’s explore how this works.
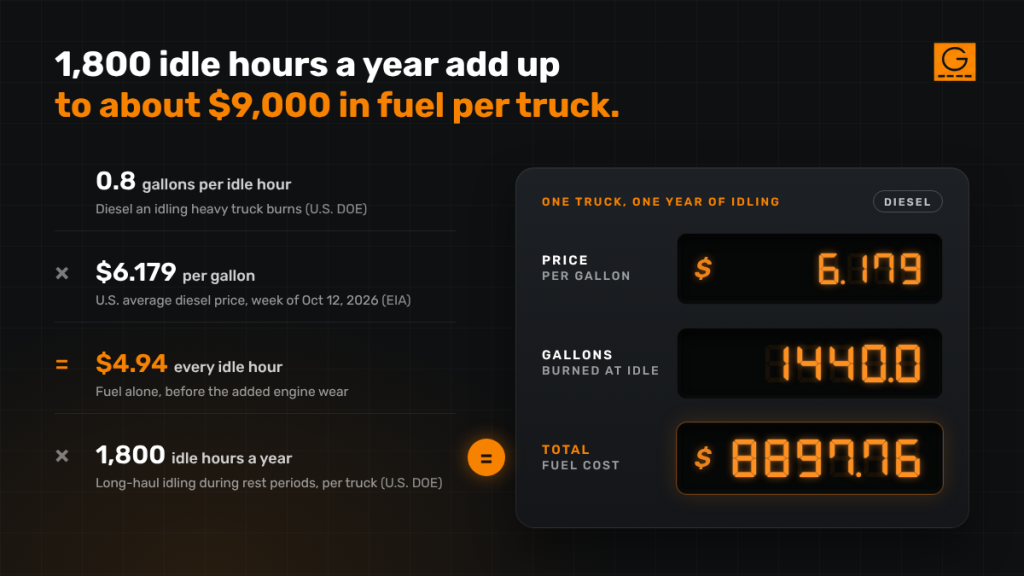
According to the U.S. Department of Energy, an idling heavy truck burns about 0.8 gallons of diesel per hour, and a typical long-haul truck idles roughly 1,800 hours a year during rest periods alone. With the national average diesel price above $6 a gallon in October 2026, according to the EIA, each idle hour now costs close to $5 in fuel, and a single long-haul truck can waste roughly $9,000 a year.
Fuel is only part of the picture. Idling also accelerates engine wear, and because many warranties and maintenance intervals are based on engine hours rather than miles, every idle hour moves a truck closer to its next service. Across a whole fleet those costs compound quickly, which makes idle reduction one of the most direct ways to reduce fleet costs.
Why idle hours are a misleading fleet idle metric
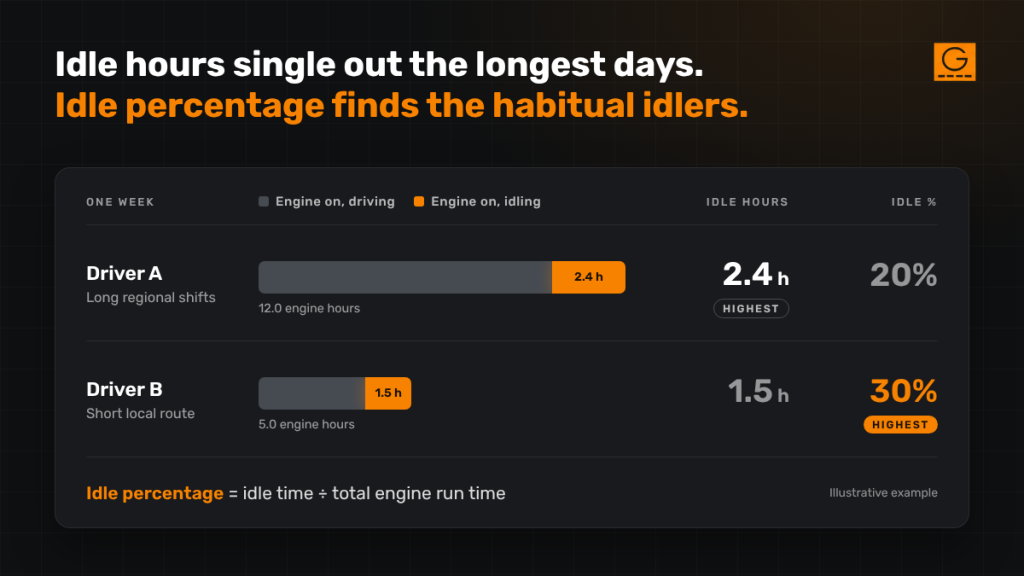
Idle hours share the same flaw as raw safety event counts, because they grow with the length of the workday. A driver on long shifts will almost always log more idle time than a driver on a short local route, even if they idle far less as a share of the time the engine is running. Ranking drivers on idle hours therefore tends to single out the people who work the longest days, while habitual idlers blend into the middle of the list.
Idle percentage solves this by dividing idle time by total engine run time. Because every driver and vehicle is measured against their own engine hours, the comparison stays fair regardless of route or shift length. It also gives managers a number they can set goals around, since a percentage target means the same thing at a busy distribution center as it does at a small depot.
Idle percentage and idle cost reporting in Gridline Analytics
Gridline knows this metric well. Co-founder Scott Tenney built the original idle percentage report for MyGeotab, and that same thinking now runs through the idle reporting in Gridline Analytics. Instead of a single idle total, fleets get a connected set of reports:
Idle Percentage and Idle Percentage Trend, which show the share of engine time spent idling and whether it is improving
Idle Duration, which shows how long vehicles sit idle by driver or vehicle
Idle Cost and Idle Cost Trend, which convert idle time into fuel dollars that leadership can act on
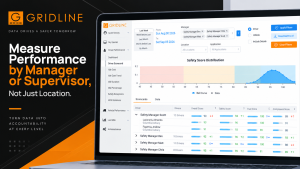
Each report can be grouped by driver, vehicle, location, or the manager responsible for a group of drivers, so idle always has an owner. Up to three years of history and a national average benchmark show how your fleet compares beyond last month’s numbers, while the Driver Opportunity view brings idle together with fuel economy and safety to highlight where coaching will save the most.
How to reduce fleet idle time and prove the savings
Reducing idle comes down to clear targets, clear ownership, and consistent follow through, and Gridline brings each of those steps into one place:
Start from a baseline. Use each location’s current idle percentage so goals reflect how your fleet operates today.
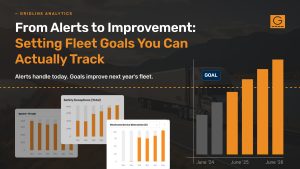
Set goals against the national average.Fleet goal setting in Gridline Analytics puts a visible goal line in front of every location and driver.
Assign ownership by manager. When idle rolls up to a named supervisor, follow up no longer depends on who has time that week.
Keep drivers in the loop.Gridline Mobile puts each driver’s weekly scorecard on their phone, so progress stays visible between coaching conversations.
Track the savings year over year. Idle Cost Trend shows what changed and what it saved, turning idle reduction into a result leadership can see.
Some idle will always be necessary, whether for extreme weather or power take off work, so the goal is to separate necessary idle from waste and make sure someone owns the difference. To see your fleet’s idle percentage and idle cost by driver, location, and manager, schedule a Gridline demo.
Frequently asked questions
What is idle percentage in fleet management?
Idle percentage is the share of a vehicle’s total engine run time spent idling, calculated by dividing idle time by engine hours. Because it is measured against each vehicle’s own engine time, it allows fair comparisons between drivers and locations with very different routes and shift lengths.
How much does truck idling cost per hour?
The U.S. Department of Energy estimates that an idling heavy truck burns about 0.8 gallons of diesel per hour. At the October 2026 national average of about $6.18 per gallon, that is nearly $5 per hour in fuel alone, before the added engine wear that idle hours bring.
What is a good idle percentage for a fleet?
There is no single right number, because idle varies with climate, vocation, and duty cycle. The best approach is to start from your own baseline, compare it against a national average, and set location and driver goals from there, which is how Gridline Analytics approaches idle benchmarking.
Turn your fleet data into profitable actions
Learn more about Gridline fleet management analytics by reaching out below:
We use cookies to ensure that we give you the best experience on our website. If you continue to use this site we will assume that you are happy with it.