Telematics platforms do an important, tactical job. When something happens in your fleet, you know about it. A speeding event fires an alert, an engine code appears, a driver submits a defect report, AI video detects distracted driving, your emailed reports are delivered to your inbox each morning, and your team responds immediately with the data at their fingertips. That agility matters, and it keeps fleets running day to day, all of it resting on a reliable Geotab foundation.
But individual notifications or emailed reports, by nature, cannot answer the bigger, strategic question every fleet leader eventually asks: are we actually improving? An alert tells you what happened today. It does not tell you whether performance from June 2027 is better than June 2026, whether your coaching efforts are working, or whether that 2026 goal you set in January is on track. That is the gap Gridline Analytics was built to fill. Built on top of the trusted Geotab foundation and drawing directly from MyGeotab, Gridline developed its own analytics platform that retains up to three years of data, so fleets can set real goals, see them clearly, and measure progress against them. Where the base platform is the tactical tool for day-to-day information, Gridline is the strategic layer for planning and accountability.
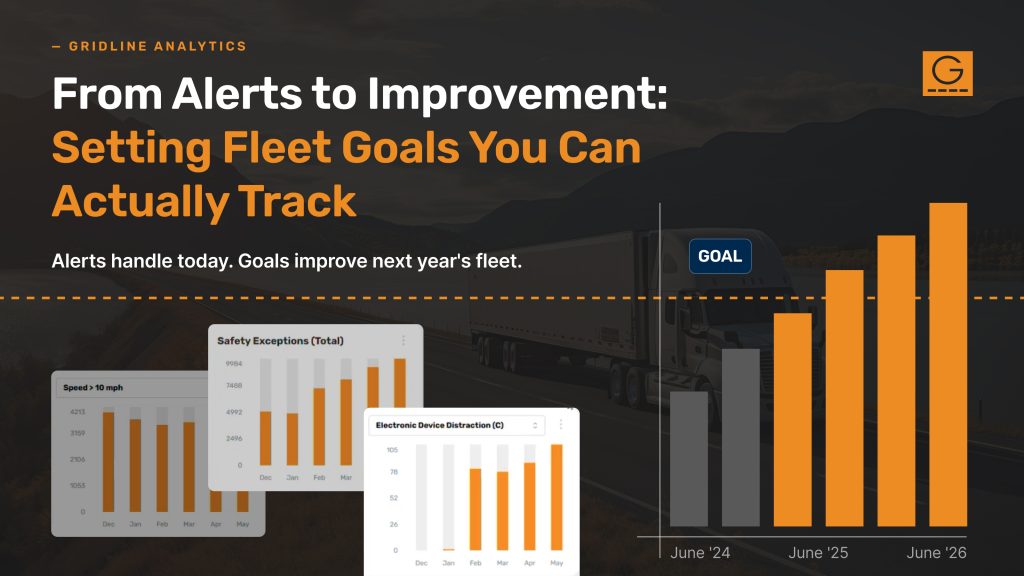
A goal without a baseline is just a wish. To set a meaningful target, you need to know where you have been, and to evaluate progress fairly, you need enough history to make an honest comparison. Most telematics platforms retain roughly a year of data, which means those comparisons run out quickly.
Gridline Analytics retains up to three years of data, and that changes what is possible. Fleets are seasonal businesses, so comparing May to June rarely tells the full story. May might be your slow season while June is your busiest month, and stacking them against each other leads to the wrong conclusions. The comparison fleets actually want is June 2027 against June 2026, or even against June 2025, because those periods reflect similar business cycles, routes, weather, and demand. Three years of history makes true year-over-year goal tracking possible, and it lets leaders confirm whether an improvement is a real trend or a single good month.
Historical depth also helps fleets connect goals to the outcomes they actually care about. Take fuel cost as an example. If the objective is to reduce fuel spend, the metric to watch is idle time, because idling burns fuel without moving freight or completing jobs. Without history, a fleet can only guess whether idle is trending in the right direction. With three years of data, they can see it plainly. And because Gridline expresses idle as a normalized percentage of engine run time, it can translate that percentage into dollars, turning an idle goal into a fuel-savings figure leadership can actually put a value on.
Effective goals share a few traits. They are based on a measurable metric, grounded in your actual performance rather than an arbitrary number, and visible to the people responsible for hitting them. A goal that lives in a memo does not change behavior. A goal that appears on the dashboard your managers look at every day does.
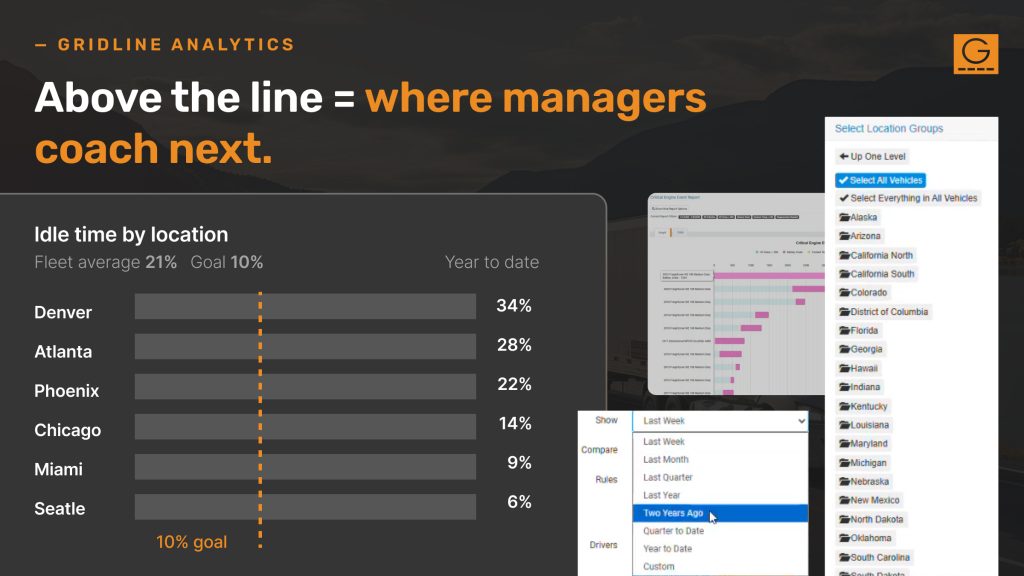
Consider a fleet averaging 30 percent idle time that wants to get to 10 percent. In Gridline Analytics, that 10 percent target becomes a visible goal line directly in the dashboard and the mobile application for drivers. Any location or group above the line is immediately identifiable as needing attention, so managers know exactly where to focus their coaching conversations. There is no ambiguity and no debate, because everyone is looking at the same line.
Just as important is the ability to measure at different levels. A vice president can view idle performance year to date across the entire organization, while a regional manager can break the same goal out by location, group, or driver. Because the KPIs that feed those goals, like seat-belt use, braking, distraction, speeding, following distance, Hours of Service, sit right in the dashboard with no menu-clicking or spreadsheet-building, the goal stays in front of every level of the business. And goals only work when each level can see its own piece of them.
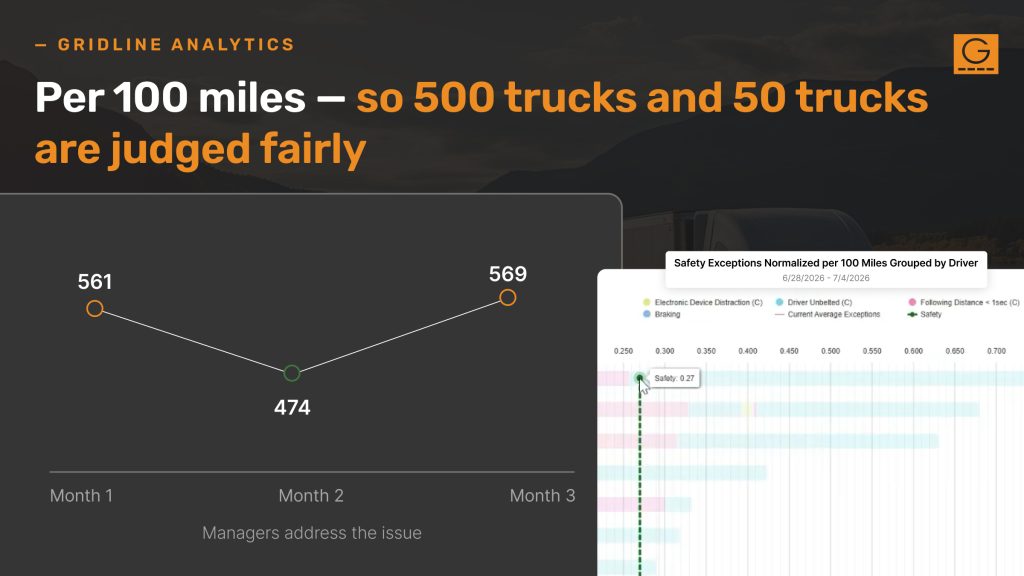
A goal only matters if you can honestly answer whether you got better. Raw event counts can mislead, because a location with 500 vehicles will naturally generate more events than a location with 50. The same distortion shows up driver to driver: 20 safety exceptions over 2,000 miles is a very different risk profile from 20 over 200. Gridline Analytics normalizes metrics per 100 miles, so a target like 0.2 safety exceptions per 100 miles gives every group and driver a fair standard regardless of size or activity level.
Not every event carries the same weight, either. Where the base platform reliably flags an unsafe event, Gridline weights it by severity, so a goal reflects how serious the behavior actually was, not just how many times it happened. And grounding a target in your own history is only the start. Gridline also lets you benchmark against your company national average, so a location can see whether it is ahead of or behind the wider organization, not just whether it beat its own last quarter.
Normalization also keeps the goal realistic. Simply declaring a target of zero events never works, because it gives teams nothing achievable to aim for and quickly loses credibility. A target grounded in your historical averages gives people something they can actually reach, and it gives leadership a fair way to hold teams accountable.
The comparison view then tells the truth about progress. Everyone loves a scorecard and Gridline’s is a custom, weighted one, combining up to eight events across telematics, video, idle, and HOS, so the score reflects how your fleet defines risk rather than a fixed formula. But even the best scorecard only shows who performed well this month. Comparing this year against last year, or last year against two years ago, shows who genuinely achieved reductions.
Picture a fleet tracking seat-belt exceptions: events sit at 561 in one month, drop to 474 after managers address the issue, then climb back to 569 the following month. The data makes it plain that the intervention created a temporary change, not a lasting one, and the problem still needs work.
That kind of honesty is exactly what goal tracking should deliver. The dashboards provide the visibility, and it is then up to leadership to drive the process, revisit the goal regularly, and keep teams engaged. Fleets that treat goal review as a monthly management habit, rather than a one-time exercise, are the ones that see behavior actually change.
Most fleet leaders believe they already know their top problems, and they usually name speeding, distraction, and following distance. The data typically confirms those assumptions, which builds confidence in the numbers. But it also surfaces the issues sitting right behind them that nobody was watching, and those hidden problems are often just as costly.
This is where goal setting becomes smarter. Instead of building goals around what people think is happening, fleets can build them around what the data shows is happening. The result is a set of priorities backed by evidence, which makes buy-in from managers and drivers far easier to earn. Safety goals grounded in real patterns also pay off beyond compliance, because unsafe driving drives up vehicle wear, repair costs, and the far larger costs that come with accidents and injuries.
Goal setting is not limited to driver behavior. Individual defect reports and engine codes get resolved one at a time, and that will always be the job. A driver reports a defect, the maintenance manager sees the truck needs new brakes, the repair happens, and everyone moves on. What gets lost in that workflow is the pattern.
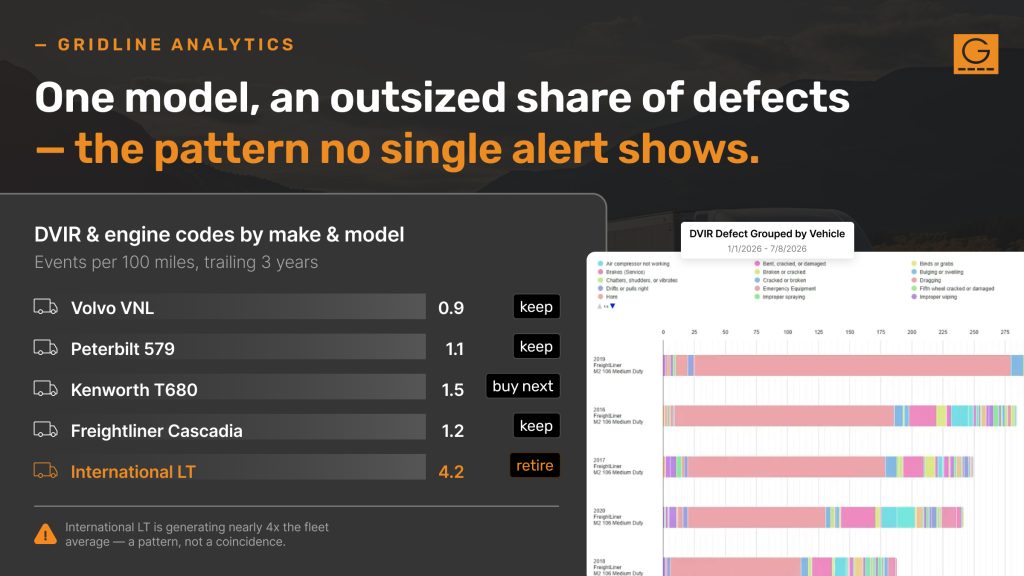
When Gridline Analytics consolidates driver vehicle inspection reports and critical engine events by year, make, and model, patterns emerge that no single alert could reveal. Suddenly you can see that one truck model generates an outsized share of defect reports, or that another model has produced thousands of low-battery alerts that point to a systemic issue rather than a series of coincidences. Normalized per 100 miles, this view stays fair even when one model dominates your fleet.
Three years of that history supports real goals around asset utilization and procurement. Leaders can decide with confidence which vehicles to retire, which to keep, and which to buy next, because the decision rests on documented performance instead of anecdotes from the shop floor. Maintenance data stops being a stream of tickets and becomes a lifecycle strategy.
There is a perception that this kind of analysis belongs to heavy trucking, but the reality is much broader. Field service, construction, distribution, and mixed fleets all face the same management challenge. Every fleet leader needs to know where performance stands, whether it is improving, and where attention is needed. The industries differ, but the discipline is identical, and historical data with visible goals is a universal management tool.
Before setting your next fleet performance goal, ask:
Alerts handle today’s problems. Goals improve next year’s fleet. With up to three years of history, visible targets at every level of the organization, normalized and severity-weighted comparisons, and insight across safety, fuel, maintenance, and vehicle performance, Gridline Analytics gives fleets what notifications alone never could: the ability to set a goal, see it clearly, and know when they have reached it. To see the goals dashboard for yourself, schedule a conversation today.

Learn more about Gridline fleet management analytics by reaching out below: